Thursday, October 29, 2015

$ENJ cheapest #stock by PE in Power Generation industry; PE 6.13 vs.avg. 16.465343

By one measure, price-to-earnings ratio, Entergy New Orleans, Inc. First -
$ENJ is the cheapest stock in the Power Generation industry.

ENJ has a P/E of 6.13 while the average stock in the industry goes for
16.465343.

By book value, the stock has been trading at 0.87 times P/B.

The stock last changed hands for $25.15. In the past year, it has traded in
a range between $23.69 - $25.34

$ORIG cheapest #stock by PE in Oil & Gas Production industry; PE 0.88 vs.avg. 16.487461

By one measure, price-to-earnings ratio, Ocean Rig UDW Inc. - $ORIG is the
cheapest stock in the Oil & Gas Production industry.

ORIG has a P/E of 0.88 while the average stock in the industry goes for
16.487461.

By book value, the stock has been trading at 0.08 times P/B.

The stock last changed hands for $2.03. In the past year, it has traded in
a range between $1.82 - $14.08

$ROVI is one of biggest losers #stocks today. read more:

Rovi Corporation (symbol: ROVI) was one of the worst losers of the trading
day today (2015-10-29), losing -22.96%. The number of shares that changed
hands was 7,615,459, or about 5 times the average daily volume in the stock.
The closing price was $8.69, amounting to a market cap of $740,810,000,
about -67.13% off the highest price in the last 12 months. The stock has
been trading at a range between $8.01 and $26.44.
ROVI is in the Multi-Sector Companies industry, part of the Miscellaneous
sector.

$FELP is one of biggest losers #stocks today. read more:

Foresight Energy LP Common Unit (symbol: FELP) was one of the worst losers
of the trading day today (2015-10-29), losing -25.0%. The number of shares
that changed hands was 2,505,907, or about 12 times the average daily
volume in the stock.
The closing price was $5.16, amounting to a market cap of $671,280,000,
about -73.26% off the highest price in the last 12 months. The stock has
been trading at a range between $4.9 and $19.3.
FELP is in the Coal Mining industry, part of the Energy sector. It first
went public in 2014.
Looking at its valuation, the stock is now trading at 7.41 times earnings.

$FSL is one of biggest losers #stocks today. read more:

Freescale Semiconductor, Ltd Co (symbol: FSL) was one of the worst losers
of the trading day today (2015-10-29), losing -16.65%. The number of shares
that changed hands was 4,508,551, or about 3 times the average daily volume
in the stock.
The closing price was $31.69, amounting to a market cap of $9,860,000,000,
about -30.61% off the highest price in the last 12 months. The stock has
been trading at a range between $17.82 and $45.67.
FSL is in the Semiconductors industry, part of the Technology sector. It
first went public in 2011.
Looking at its valuation, the stock is now trading at 29.59 times earnings.

$RVNC is one of biggest winner #stocks today. read more:

Revance Therapeutics, Inc. (symbol: RVNC) was one of the biggest winners of
the trading day today (2015-10-29), gaining 40.63%. The number of shares
that changed hands was 4,423,066, or about 26.8 times the average daily
volume in the stock.
The closing price was $37.59, amounting to a market cap of $900,280,000,
about -2.34% off the highest price in the last 12 months. The stock has
been trading at a range between $14.02 and $38.49.
RVNC is in the Major Pharmaceuticals industry, part of the Health Care
sector. It first went public in 2014.

$QDEL is one of biggest winner #stocks today. read more:

Quidel Corporation (symbol: QDEL) was one of the biggest winners of the
trading day today (2015-10-29), gaining 17.65%. The number of shares that
changed hands was 1,570,438, or about 6.2 times the average daily volume in
the stock.
The closing price was $20.4, amounting to a market cap of $683,930,000,
about -30.57% off the highest price in the last 12 months. The stock has
been trading at a range between $17.16 and $29.38.
QDEL is in the Biotechnology: In Vitro & In Vivo Diagnostic Substances
industry, part of the Health Care sector.

$BWLD is one of biggest losers #stocks today. read more:

Buffalo Wild Wings, Inc. (symbol: BWLD) was one of the worst losers of the
trading day today (2015-10-29), losing -17.33%. The number of shares that
changed hands was 4,322,460, or about 9 times the average daily volume in
the stock.
The closing price was $152.45, amounting to a market cap of $2,900,000,000,
about -25.93% off the highest price in the last 12 months. The stock has
been trading at a range between $148.04 and $205.83.
BWLD is in the Restaurants industry, part of the Consumer Services sector.
It first went public in 2003.
Looking at its valuation, the stock is now trading at 31.36 times earnings.

$ABMD is one of biggest losers #stocks today. read more:

ABIOMED, Inc. (symbol: ABMD) was one of the worst losers of the trading day
today (2015-10-29), losing -28.59%. The number of shares that changed hands
was 6,293,987, or about 8 times the average daily volume in the stock.
The closing price was $70.4, amounting to a market cap of $2,940,000,000,
about -36.39% off the highest price in the last 12 months. The stock has
been trading at a range between $26.5 and $110.68.
ABMD is in the Medical/Dental Instruments industry, part of the Health Care
sector.
Looking at its valuation, the stock is now trading at 24.94 times earnings.

$SPWR is one of biggest winner #stocks today. read more:

SunPower Corporation (symbol: SPWR) was one of the biggest winners of the
trading day today (2015-10-29), gaining 11.13%. The number of shares that
changed hands was 3,456,127, or about 2.4 times the average daily volume in
the stock.
The closing price was $27.36, amounting to a market cap of $3,730,000,000,
about -22.07% off the highest price in the last 12 months. The stock has
been trading at a range between $18.25 and $35.11.
SPWR is in the Semiconductors industry, part of the Technology sector. It
first went public in 2005.
Looking at its valuation, the stock is now trading at 24.52 times earnings.

$LOCK is one of biggest winner #stocks today. read more:

LifeLock, Inc. (symbol: LOCK) was one of the biggest winners of the trading
day today (2015-10-29), gaining 43.86%. The number of shares that changed
hands was 15,456,611, or about 9.3 times the average daily volume in the
stock.
The closing price was $13.94, amounting to a market cap of $1,330,000,000,
about -27.21% off the highest price in the last 12 months. The stock has
been trading at a range between $7.18 and $19.15.
LOCK is in the EDP Services industry, part of the Technology sector. It
first went public in 2012.

#pennystocks up strongly today: $NETE +23.1%, $NSLP +15.4%, $OIBR +15.0%, $RLJE +14.6%, $GLRI +12.2%, #pennystock

Penny stocks moving up strongly today:

Net Element, Inc. (symbol: NETE) ended the trading day today (2015-10-29),
at $0.105 gaining 23.095%. The number of shares that changed hands was
3,444,548, or about 1.5 times the average daily volume in the stock. The
end-of-day market cap was $7,050,000, about -95.093% off the highest price
in the last 12 months. The stock has been trading at a range between $0.08
and $2.14. NETE is in the EDP Services industry, part of the Technology
sector.


null (symbol: NSLP) ended the trading day today (2015-10-29), at $0.15
gaining 15.38%. The number of shares that changed hands was 217,352, or
about 1.3 times the average daily volume in the stock. The end-of-day
market cap was $2,810,000, about -99.29% off the highest price in the last
12 months. The stock has been trading at a range between $0.07 and $21.16.
NSLP is in the Oil & Gas Production industry, part of the Energy sector. It
first went public in 2013.


Oi S.A. American Depositary Sha (symbol: OIBR) ended the trading day today
(2015-10-29), at $0.5279 gaining 15.0109%. The number of shares that
changed hands was 2,083,604, or about 1.1 times the average daily volume in
the stock. The end-of-day market cap was $369,770,000, about -91.2017% off
the highest price in the last 12 months. The stock has been trading at a
range between $0.4 and $6.0. OIBR is in the Telecommunications Equipment
industry, part of the Public Utilities sector. It first went public in 2014.


RLJ Entertainment, Inc. (symbol: RLJE) ended the trading day today
(2015-10-29), at $0.94 gaining 14.63%. The number of shares that changed
hands was 20,717, or about 0.8 times the average daily volume in the stock.
The end-of-day market cap was $12,000,000, about -77.07% off the highest
price in the last 12 months. The stock has been trading at a range between
$0.26 and $4.1. RLJE is in the Movies/Entertainment industry, part of the
Consumer Services sector.


Glori Energy Inc (symbol: GLRI) ended the trading day today (2015-10-29),
at $0.92 gaining 12.2%. The number of shares that changed hands was 1,641,
or about 0.0 times the average daily volume in the stock. The end-of-day
market cap was $29,300,000, about -83.33% off the highest price in the last
12 months. The stock has been trading at a range between $0.61 and $5.52.
GLRI is in the Oil & Gas Production industry, part of the Energy sector.

$NXPI is one of biggest losers #stocks today. read more:

NXP Semiconductors N.V. (symbol: NXPI) was one of the worst losers of the
trading day today (2015-10-29), losing -19.71%. The number of shares that
changed hands was 36,637,869, or about 9 times the average daily volume in
the stock.
The closing price was $73.0, amounting to a market cap of $18,380,000,000,
about -35.96% off the highest price in the last 12 months. The stock has
been trading at a range between $63.52 and $114.0.
NXPI is in the Semiconductors industry, part of the Technology sector. It
first went public in 2010.
Looking at its valuation, the stock is now trading at 38.58 times earnings.

#pennystocks making new 52-wk lows: $LIQD $ATOS $ENZN $ARCI #pennystock to read more:

Penny stocks making 52 week lows today:

Liquid Holdings Group, Inc. (symbol: LIQD) ended the trading day today
(2015-10-29), at $0.03 losing -11.76%. The number of shares that changed
hands was 455,543, or about 1 times the average daily volume in the stock.
The end-of-day market cap was $1,820,000, about -97.44% off the highest
price in the last 12 months. The stock has been trading at a range between
$0.03 and $1.17. LIQD is in the Computer Software: Prepackaged Software
industry, part of the Technology sector. It first went public in 2013.


Atossa Genetics Inc. (symbol: ATOS) ended the trading day today
(2015-10-29), at $0.65 losing -4.41%. The number of shares that changed
hands was 102,548, or about 1 times the average daily volume in the stock.
The end-of-day market cap was $18,880,000, about -75.47% off the highest
price in the last 12 months. The stock has been trading at a range between
$0.65 and $2.65. ATOS is in the Medical/Dental Instruments industry, part
of the Health Care sector. It first went public in 2012.


Enzon Pharmaceuticals, Inc. (symbol: ENZN) ended the trading day today
(2015-10-29), at $0.71 losing -4.05%. The number of shares that changed
hands was 233,818, or about 0 times the average daily volume in the stock.
The end-of-day market cap was $31,370,000, about -62.23% off the highest
price in the last 12 months. The stock has been trading at a range between
$0.71 and $1.88. ENZN is in the Biotechnology: Biological Products (No
Diagnostic Substances) industry, part of the Health Care sector. It first
went public in 1984.
Looking at its valuation, the stock is now trading at 1.29 times earnings.

Appliance Recycling Centers of America, Inc. (symbol: ARCI) ended the
trading day today (2015-10-29), at $0.78 losing -8.24%. The number of
shares that changed hands was 81,925, or about 8 times the average daily
volume in the stock. The end-of-day market cap was $4,520,000, about
-74.76% off the highest price in the last 12 months. The stock has been
trading at a range between $0.78 and $3.09. ARCI is in the Home Furnishings
industry, part of the Consumer Services sector.

$INT is one of biggest winner #stocks today. read more:

World Fuel Services Corporation (symbol: INT) was one of the biggest
winners of the trading day today (2015-10-29), gaining 12.82%. The number
of shares that changed hands was 2,211,294, or about 4.7 times the average
daily volume in the stock.
The closing price was $43.83, amounting to a market cap of $3,150,000,000,
about -25.08% off the highest price in the last 12 months. The stock has
been trading at a range between $33.83 and $58.5.
INT is in the Oil Refining/Marketing industry, part of the Energy sector.
Looking at its valuation, the stock is now trading at 15.01 times earnings.

$GTLS is one of biggest losers #stocks today. read more:

Chart Industries, Inc. (symbol: GTLS) was one of the worst losers of the
trading day today (2015-10-29), losing -23.83%. The number of shares that
changed hands was 2,458,622, or about 5 times the average daily volume in
the stock.
The closing price was $16.46, amounting to a market cap of $502,750,000,
about -66.19% off the highest price in the last 12 months. The stock has
been trading at a range between $16.33 and $48.68.
GTLS is in the Metal Fabrications industry, part of the Capital Goods
sector. It first went public in 2006.
Looking at its valuation, the stock is now trading at 6.94 times earnings.

$FOGO cheapest #stock by PE in Restaurants industry; PE 0.96 vs.avg. 29.854254

By one measure, price-to-earnings ratio, null - $FOGO is the cheapest stock
in the Restaurants industry.

FOGO has a P/E of 0.96 while the average stock in the industry goes for
29.854254.

By book value, the stock has been trading at 1.77 times P/B.

The stock last changed hands for $15.14. In the past year, it has traded in
a range between $14.11 - $27.19

$MGPI cheapest #stock by PE in Beverages (Production/Distribution) industry; PE 11.65 vs.avg. 31.907978

By one measure, price-to-earnings ratio, MGP Ingredients, Inc. - $MGPI is
the cheapest stock in the Beverages (Production/Distribution) industry.

MGPI has a P/E of 11.65 while the average stock in the industry goes for
31.907978.

By book value, the stock has been trading at 2.63 times P/B.

The stock last changed hands for $17.32. In the past year, it has traded in
a range between $11.97 - $19.22

$IRDM is one of biggest winner #stocks today. read more:

Iridium Communications Inc (symbol: IRDM) was one of the biggest winners of
the trading day today (2015-10-29), gaining 22.24%. The number of shares
that changed hands was 3,951,102, or about 4.2 times the average daily
volume in the stock.
The closing price was $7.97, amounting to a market cap of $755,950,000,
about -29.84% off the highest price in the last 12 months. The stock has
been trading at a range between $5.85 and $11.36.
IRDM is in the Telecommunications Equipment industry, part of the Consumer
Durables sector.
Looking at its valuation, the stock is now trading at 10.83 times earnings.

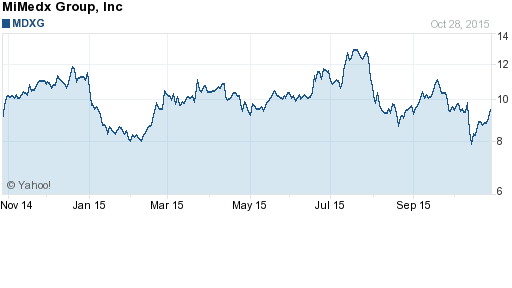
$MDXG is one of biggest losers #stocks today. read more:

MiMedx Group, Inc (symbol: MDXG) was one of the worst losers of the trading
day today (2015-10-29), losing -23.18%. The number of shares that changed
hands was 8,372,622, or about 6 times the average daily volume in the stock.
The closing price was $7.29, amounting to a market cap of $793,940,000,
about -44.77% off the highest price in the last 12 months. The stock has
been trading at a range between $6.71 and $13.2.
MDXG is in the Medical/Dental Instruments industry, part of the Health Care
sector.
Looking at its valuation, the stock is now trading at 54.0 times earnings.